- Visibility 17 Views
- Downloads 4 Downloads
- DOI 10.18231/j.ijcbr.2023.038
-
CrossMark

Concordance between low density lipoprotein cholesterol concentration measurement by enzymatic method and calculation by Friedewald formula in cardiovascular risk classification
Introduction
The National Cholesterol Education Program Adult Treatment Panel III (NCEP ATP III) and the European Society of Cardiology (ESC) both recognize low-density lipoprotein cholesterol (LDL-C) as a risk factor for cardiovascular disease (CVD), and it is used as a treatment target for cholesterol-lowering therapy.[1], [2]
Patients are initially classified using the Framingham risk score[3] based on their risk factors, and then each class of patients is allocated a target LDL-C concentration to which lipid-lowering drugs are directed.[1] As a result, accurate LDL-C assessment is critical to ensuring that patients on lipid-lowering therapy are attaining their risk-stratified targets.
At present, there are a number of different techniques for measuring LDL-C, which can be divided into non-automatic analytical techniques, LDL-C calculations, and automated direct measurements.
Beta quantification, which combines ultracentrifugation and polyanionic precipitation to separate lipoprotein particles, is the gold standard for measuring LDL-C level.[4], [3] This method, however, is costly, requires specialized equipment, and is time consuming, making it unsuitable for most common clinical laboratories.
In 1972, Friedewald introduced a method for estimating LDL-C level, which has since become the standard of care in clinical practice around the world due to its convenience, cost-effectiveness, and time-saver over beta quantification.[5] This method involves subtracting the cholesterol concentration of all lipoprotein groups other than LDL ((High density lipoprotein (HDL) and very low density lipoprotein (VLDL)) from the total cholesterol (TC) concentration. While this method is convenient, it has some well-known limitations, methodological errors can accumulate because this formula requires three separate analyses of TC, triglycerides (TG), and HDL-C, it assumes a constant cholesterol / TG ratio for VLDL. Additionally, high TG values (>400 mg/dL/ > 4.5 mmol/L) are not eligible for the formula. To overcome these limitations, various other formulas with varying results in various populations have been proposed.[6]
Automated direct measurements of LDL-C concentration are an alternative to beta quantification, and are easily applicable to clinical settings. Two well-known automated direct measurement methods are heterogeneous selective precipitation[7] and direct homogeneous methods.[8] These direct homogeneous methods are completely automated and straightforward to use. As a result of their automated nature, they have increased precision from non- manual pipetting, as well as precise timing and temperature control.[9] However, unlike direct LDL-C calculation, which is free of charge due to the inclusion of other lipid tests within the standard lipid panel, there is a cost associated with the administration of direct LDL-C tests. Despite its limitations, the Friedewald formula remains the most commonly used method for LDL-C calculation in laboratories.
Since July 2021, the biochemistry laboratory of the medical biology department of the university hospital center of Angré, started to switch from the Friedewald formula to direct homogeneous enzymatic method. It was therefore appropriate to assess the relevance of this choice of method. The objective of the study was to evaluate the equivalency of direct measurements of LDL-C concentrations to those calculated with the aid of Friedewald's formula.
Material and Methods
Study design
The current study is a retrospective analysis of outpatient recorded in the laboratory database of University Hospital Center of Angré (Abidjan, Côte d'Ivoire).
Inclusion & exclusion criteria
The analysis included 752 lipid profiles from 710 subjects, of ≥18 years old, both male and female, with available values of direct LDL-C, TG, TC and HDL-C measurements in the laboratory database. Excluded lipid profiles included those that were TG >400 mg/dL (> 4.5 mmoL/L).
Ethical approval & informed consent
As this was a data review of standard of care, ethics committee approval was not required.
Methods
Patient data (TG, TC, LDL-C, HDL-C, age, and gender) was extracted from the hospital database system between July 2021 and June 2023. All biochemical analyses were conducted using the Cobas c311 Analyzer from Roche Diagnostics GmbH. Daily quality control (QC) was conducted for more than 30 days prior to and throughout the duration of the study, utilizing two levels of Roche diagnostic controls (Cobas Precicontrol Clin Chem Multi 1 and Cobas Precicontrol Clin Chem Multi 2).
The Coefficient of analytical variation (CVA) of LDL-C assay was calculated. The intermediate precision of the assay was 3.4% for low control level and 4% for high level. LDL-C was then calculated using Friedewald formula (7), that is:
LDL-C (mg/dL) = TC – [HDL + TG/5] or LDL-C (mmoL/L) = TC – [HDL + TG/2].
The data were analyzed and structured using Microsoft Excel. The statistical analysis was conducted with MedCalc and the significance level was set at <0.05. Descriptive statistics, concordance correlation and regression analyses were performed to assess the strength of concordance between the two methods, and identify any possible bias.
Results
Descriptive statistics, including the mean and coefficient of variation (CV%) were calculated for the LDL-C values ([Table 1]). The concordance correlation analysis was performed using Lin’s concordance correlation coefficient (ccc) (ρc = 0.9466 and 95% confidence interval (CI) = 0.9396 to 0.9528). The linear relationship between both measurements, a condition for the applicability of Passing-Bablok analysis was verified and accepted by the Cusum test (p=0,92).
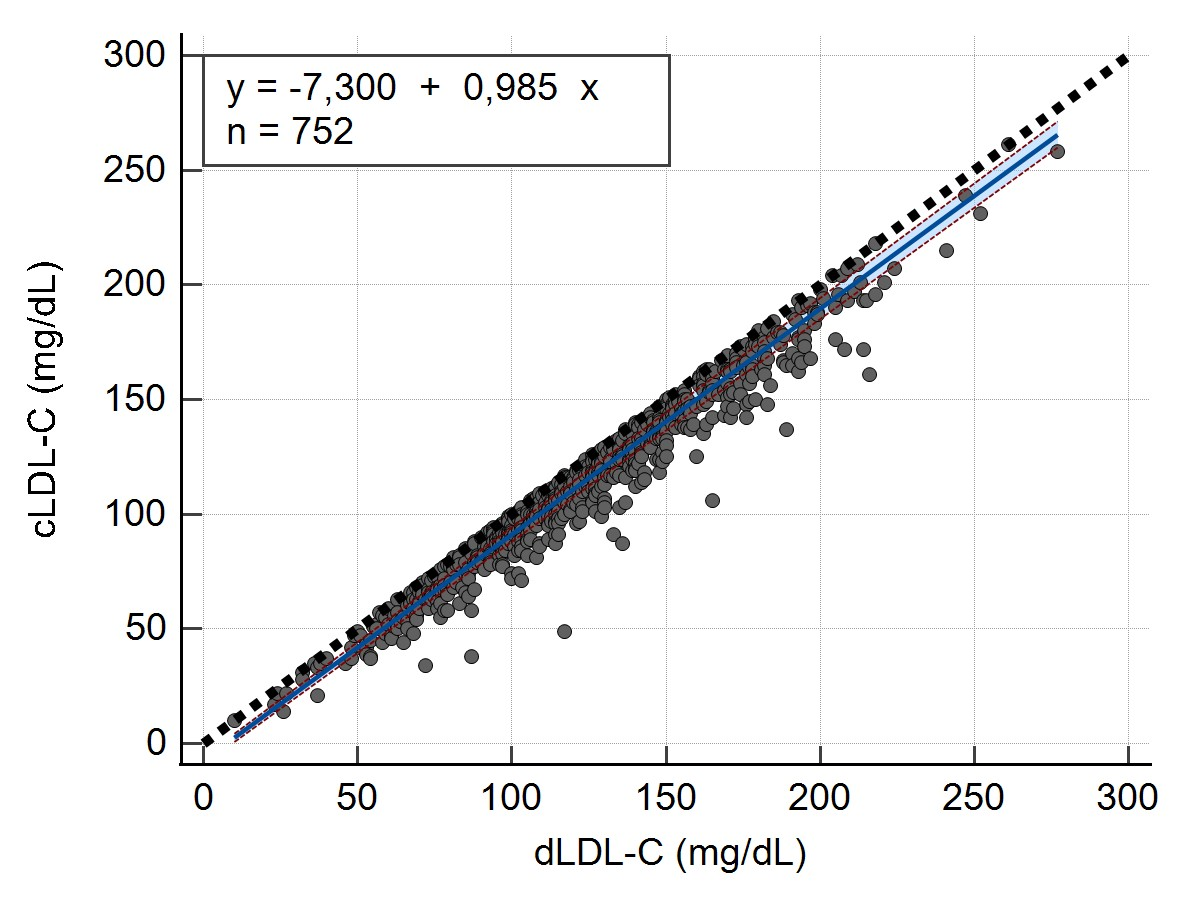
A Passing-Bablok regression analysis was conducted to establish a regression equation between the calculated LDL-C values and measured LDL-C values. This analysis aimed to determine whether there were a constant bias (intercept) or proportional bias (slope) between the 2 methods, as well as estimate the random error (RSD) for both methods ([Table 2]).
Scatter diagram ([Figure 1]) was also generated to show regression line (blue line), confidence bands for regression line and identity line (dashed line).
To evaluate the concordance in LDL-C risk classification between calculated LDL-C and measured LDL-C, we categorized LDL-C values according to NCEP ATP III guidelines for the management of dyslipidemia into five categories ([Table 3]).
The difference between the two methods (Bias) was calculated using Passing-Bablok regression equations, and further combined with the coefficient of analytical variation (CVA) of the measured method in order to calculate the total error observed (TEobs) between the 2 methods. Total Error (TE) was calculated with the formula: TEobs = 1.65 CVA + Bias.
|
|
Mean (mg/dL / mmoL/L) |
CV% |
|
Measured LDL-C |
124,5 / 3.21 |
33 |
|
Calculated LDL-C |
113,9 / 2,95 |
36 |
|
Regression equation |
Intercept (95% CI) |
Slope (95% CI) |
Residual standard deviation (RSD) |
|
y = -7,300 + 0,985x |
-9,0000 to -5,7018 |
0,9708 to 1,0000 |
6,1655 |
|
No. |
Categories |
Reference Ranges (mg/dL) |
|
1 |
Optimal |
˂ 100 |
|
2 |
Near or above optimal |
100 to 129 |
|
3 |
Borderline high |
130 to 159 |
|
4 |
High |
160 to 189 |
|
5 |
Very high |
≥ 190 |
|
Categories |
MDL mg/dL (mmoL/L) |
CVA (%) |
Bias (%) |
TEobs (%) |
ATE (%) |
|
Optimal |
100 (2,59) |
3,4 |
9,0 |
15 |
12 |
|
Near or above optimal |
129 (3,34) |
4 |
7,3 |
14 |
12 |
|
Borderline high |
159 (4.11) |
4 |
6,3 |
13 |
12 |
|
High |
189 (4,89) |
4 |
5,5 |
12 |
12 |
|
Very high |
190 (4,91) |
4 |
5,5 |
12 |
12 |
Discussion
Atherosclerotic cardiovascular disease (ASCVD) is one of the main causes of death worldwide. Hypercholesterolemia is the most common causal factor for ASCVD with LDL-C as primary target for lipid lowering therapy.[10] It is essential to accurately estimate LDL-C level in order to guarantee that patients are adhering to the risk-strategized objectives of lipid reduction therapy. This is due to the numerous clinical decisions that are typically made regarding LDL-C readings obtained from clinical laboratories. Due to the high cost of beta quantification via ultracentrifugation and time-consuming, direct measurement of LDL-C is an alternative method in many biochemistry laboratories.[11], [12] Previous research has demonstrated that the majority of direct homogeneous processes meet the criteria mandated by the National Center for the Evaluation of Polymers (NCEP).[13] Despite the limitations of estimating LDL-C by Friedewald equation, most of clinical laboratories still do not routinely offer direct LDL-C. Roche direct LDL-C method (Roche Diagnostics, GmbH) was introduced in our laboratory at the middle of the year 2021. This study compared Friedewald’s LDL-C estimates with direct homogeneous LDL-C measurements for 752 lipid profiles with TG concentrations below 400 mg/dL (4,5 mmoL/L). Many studies, using a variety of statistical techniques as been reported.[14], [15]
The level of agreement of the Lin’s concordance correlation coefficient was moderate, but the two methods were not in satisfactory agreement. According to previous studies, calculations of LDL-C based on the Friedewald equation correlated well with direct measurement of LDL-C, almost, calculated LDL-C was underestimated in comparison to measured LDL-C.[16], [17] Pearson's correlation coefficient should not be used as the sole criterion for determining the equivalence of methods. Furthermore, high correlation does not necessarily mean agreement since the correlation coefficient cannot detect systematic bias.[18], [19] Therefore, the concordance correlation analysis is the significant method to determine agreement between methods. Lin's concordance coefficient quantifies the robustness of a relationship between two measures by determining the deviation from the standard deviation, thus also accounting for systematic variations between methods.[18]
Passing-Bablok regression showed that calculated LDL-C systematically underestimated LDL-C concentrations relative to measured LDL-C. Our results are in line with those of Jagesh[20] and Lee.[21] However, this finding is not agreement with reports from a study conducted by Ephraim et al. in a Ghanaian population[22] and Boshtam et al. in an Iranian population.[23] Moreover, Edjème-Aké et al., found no difference in an Ivorian population.[24] The discrepancies between studies may be attributed to discrepancies in the methodology of LDL-C measurements, the size of the patient population, and the characteristics of the patients. Indeed, direct LDL-C tests, commercially available, are enzymatic colorimetric procedures that use cholesterol esterase and cholesterol oxidase to quantify lipids. To achieve selective solubilization of the non-LDL-C and LDL-C fractions, proprietary chemical detergents are used. The accuracy of direct LDL-C measurement depends on the specificity of masking reagent.
In view of the fact that measurement errors must be taken into account in both of these methods, it was determined that the most appropriate method to use for bias estimation was to use a passing-bablok regression method instead of an ordinary linear regression method. On the other hand, the results obtained from passing-bablock regression are independent of whether the method is assigned as a reference or test method.[25] The acceptance limits for method comparison were based on analytical quality specifications recommended by NCEP.[4] [Table 4] shows that both methods were not clinically equivalent in classifying peoples as optimal, near or above optimal and borderline high.
LDL-C obtained with Friedewald formula leads to underestimation of LDL-C with respect to the values obtained with the direct measurement; the lower the LDL-C value, the higher the TEobs is. This results could be explained by the fact that, a low LDL-C concentration can affect the VLDL cholesterol estimation and this can lead to incorrect LDL cholesterol calculation results.
Many clinical laboratories use Friedewald formula to estimate LDL-C when TG levels are lower than 400 mg/dL (4,5 mmoL/L). Friedewald et al. initially established the Friedewald formula's inaccuracy when TG levels above 400 mg/dL (4,5 mmoL/L).[5] Previous studies are in contrast with relying on the Friedewald formula even when TG levels are under 400 mg/dL (4,5 mmoL/L), suggesting that the Friedewald formula may still underestimate LDL-C and; thereby, cardiovascular diseases (CVD) risk when TG levels are less than 400 mg/dL (4,5 mmoL/L). Several studies reported that CVD risk is especially underestimated when TG levels are high[17], [26] and when the Friedewald-estimated LDL-C is low.[27] Thus, the 2021 lipid measurements in the management of CVD recommends that LDL-C can be estimated by TC, HDL-C, and TG measurements. For LDL-C ≥ 100 mg/dL (2,59 mmoL/L) and TG ≤ 150 mg/dL (1,69 mmoL/L), the Friedewald formula is reasonable (IIa, B-NR).
Conclusion
As LDL-C is one of the most modifiable risk factors for cardiovascular disease (CVD), accurate measurement of LDL-C levels in clinical practice is essential. This study compared direct homogeneous method vs Friedewald formula in the estimation of LDL-C. Although Friedewald formula is cost-effective for estimating LDL-C levels, under-estimated LDL-C levels can lead to misclassification in CVD risk assessments, resulting in significant future societal costs from inadequate prevention and treatment of CVD. Furthermore, underestimating the risk of LDL-C may result in false-positive diagnoses in individuals with undiagnostic conditions, resulting in serious health consequences.
Limitations of our Study
One of the limitations of this study was that the risk factors associated with cardiovascular disease were not evaluated in our population. Under the assumption that the treatment goal for LDL-C is determined by the risk category, a comparison of LDL-C risk classifications by risk category will assist in a more rigorous validation of the Friedewald equation.
Source of Funding
None.
Conflict of Interest
None.
References
- . Third Report of the National Cholesterol Education Program (NCEP) Expert Panel on Detection, Evaluation, and Treatment of High Blood Cholesterol in Adults (Adult Treatment Panel III) final report. Circulation 2002. [Google Scholar]
- F Visseren, F Mach, YM Smulders, D Carballo, KC Koskinas, Maria Bäck. 2021 ESC Guidelines on cardiovascular disease prevention in clinical practice. Eur Heart J 2021. [Google Scholar]
- PW Wilson, RB D'Agostino, D Levy, AM Belanger, H Silbershatz, WB Kannel. Prediction of coronary heart disease using risk factor categories. Circulation 1998. [Google Scholar]
- PS Bachorik, JW Ross. National Cholesterol Education Program recommendations for measurement of low-density lipoprotein cholesterol: executive summary. The National Cholesterol Education Program Working Group on Lipoprotein Measurement. Clin Chem 1995. [Google Scholar]
- WT Friedewald, RI Levy, DS Fredrickson. Estimation of the concentration of low-density lipoprotein cholesterol in plasma, without use of the preparative ultracentrifuge. Clin Chem 1972. [Google Scholar]
- C Samuel, J Park, A Sajja, ED Michos, RS Blumenthal, SR Jones. Accuracy of 23 Equations for Estimating LDL Cholesterol in a Clinical Laboratory Database of 5,051,467 Patients. Glob Heart 2023. [Google Scholar] [Crossref]
- I Jialal, SV Hirany, S Devaraj, TA Sherwood. Comparison of an immunoprecipitation method for direct measurement of LDL-cholesterol with beta-quantification (ultracentrifugation). Am J Clin Pathol 1995. [Google Scholar]
- H Sugiuchi, T Irie, Y Uji, T Chaen, K Uekama, H Okabe. Homogeneous assay for measuring low-density lipoprotein cholesterol in serum with triblock copolymer and alpha-cyclodextrin sulfate. Clin Chem 1998. [Google Scholar]
- M Nauck, GR Warnick, N Rifai. Methods for measurement of LDL-cholesterol: a critical assessment of direct measurement by homogeneous assays versus calculation. Clin Chem 2002. [Google Scholar]
- F Mach, C Baigent, AL Catapano, KC Koskinas, M Casula, L Badimon. 2019 ESC/EAS guidelines for the management of dyslipidaemias: Lipid modification to reduce cardiovascular risk. Atherosclerosis 2019. [Google Scholar]
- M Okada, H Matsui, Y Ito, A Fujiwara, K Inano. Low-density lipoprotein cholesterol can be chemically measured: a new superior method. J Lab Clin Med 1998. [Google Scholar]
- T Sakaue, T Hirano, G Yoshino, K Sakai, H Takeuchi, M Adachi. Reactions of direct LDL-cholesterol assays with pure LDL fraction and IDL: comparison of three homogeneous methods. Clin Chim Acta 2000. [Google Scholar]
- M Nauck, MS Graziani, D Bruton, C Cobbaert, TG Cole, F Lefevre. Analytical and clinical performance of a detergent-based homogeneous LDL-cholesterol assay: a multicenter evaluation. Clin Chem 2000. [Google Scholar]
- S Bolat, GE Zararsız, K Doğan, N Kochan, SI Yerlitaş, A Cephe. Concordance of LDL-C Estimating Equations with Direct Enzymatic Measurement in Diabetic and Prediabetic Subjects. J Clin Med 2023. [Google Scholar] [Crossref]
- SY Lee, SK Hahm, JA Park, SK Choi, JY Yoon, SH Choi. Measuring low density lipoprotein cholesterol: Comparison of direct measurement by hisens reagents and friedewald estimation. Korean J Fam Med 2015. [Google Scholar]
- SS Martin, MJ Blaha, MB Elshazly, EA Brinton, PP Toth, JW McEvoy. Friedewald-estimated versus directly measured low-density lipoprotein cholesterol and treatment implications. J Am Coll Cardiol 2013. [Google Scholar]
- KR Jun, HI Park, S Chun, H Park, WK Min. Effects of total cholesterol and triglyceride on the percentage difference between the low-density lipoprotein cholesterol concentration measured directly and calculated using the Friedewald formula. Clin Chem Lab Med 2008. [Google Scholar]
- LI Lin. A concordance correlation coefficient to evaluate reproducibility. Biometrics 1989. [Google Scholar]
- PJ Cornbleet, N Gochman. Incorrect least-squares regression coefficients in method-comparison analysis. Clin Chem 1979. [Google Scholar]
- R Jagesh, M John, MMN Jalaja, T Oommen, D Gopinath. Impact of Adoption of Directly Measured Low-Density Lipoprotein-Cholesterol (LDL-C) on Targets of Lipid Control and Its Comparison With Friedewald Formula-Calculated LDL Cholesterol in People With Type-2 Diabetes Mellitus. Indian J Clin Cardiol 2021. [Google Scholar]
- J Lee, S Jang, H Jeong, OH Ryu. Validation of the friedewald formula for estimating low density lipoprotein cholesterol: The korea national health and nutrition examination survey. Korean J Intern Med 2009. [Google Scholar]
- RKD Ephraim, E Acheampong, SM Swaray. Developing a Modified Low-Density Lipoprotein (M-LDL-C) Friedewald’s Equation as a Substitute for Direct LDL-C Measure in a Ghanaian Population: A Comparative Study. J Lipids 2018. [Google Scholar] [Crossref]
- M Boshtam, M A Ramezani, G Naderi, N Sarrafzadegan. Is Friedewald formula a good estimation for low density lipoprotein level in Iranian population?. J Res Med Sci 2012. [Google Scholar]
- A Edjème-Aké, ML A-Hauhouot, H Ahiboh, E Yayo, Sagou, CG Kipré, D Monnet. Détermination de la concentration sérique du cholestéroL-LDL : Comparaison entre une méthode directe de dosage et la formule de friedewald. J Sci Pharm Bol 2010. [Google Scholar]
- H Passing, Bablok. A new biometrical procedure for testing the equality of measurements from two different analytical methods. Application of linear regression procedures for method comparison studies in clinical chemistry, Part I. J Clin Chem Clin Biochem 1983. [Google Scholar] [Crossref]
- CC Lindsey, MR Graham, TP Johnston, CG Kiroff, A Freshley. A clinical comparison of calculated versus direct measurement of low-density lipoprotein cholesterol level. Pharmacotherapy 2004. [Google Scholar]
- H Scharnagl, M Nauck, H Wieland, W März. The Friedewald formula underestimates LDL cholesterol at low concentrations. Clin Chem Lab Med 2001. [Google Scholar]