- Visibility 207 Views
- Downloads 45 Downloads
- Permissions
- DOI 10.18231/j.ijcbr.2020.037
-
CrossMark

Abstract
Background & Objective: With increasing prevalence of Chronic Kidney Disease (CKD), CKD related cardiovascular diseases (CVD), end stage renal disease (ESRD) and the consequent financial burden of renal replacement therapy (RRT), the importance of CKD and its risk factors needs to be considered. Hence, lipid profile was studied in maintenance hemodialysis (MHD) subjects.
Materials and Methods: An observational study consisting 100 patients diagnosed as ESRD on MHD of age group 18-70 years of both sex were selected from Nephrology unit, KIMS, Hubballi. Serum lipid profile was estimated by enzymatic method, urea by GLDH- Urease method, serum creatinine by Jaffe’s method.
Results: A significant patients had low serum lipid levels with mean ± standard deviation of Total cholesterol (mg/dl) 131.93±49.75, Triacylglyceride (mg/dl) 107.53±52.36, HDL-C (mg/dl) 28.93±10.06 & LDL-C (mg/dl) 82.23±42.89 and serum creatinine (mg/dl) 8.28± 2.45 & Blood urea (mg/dl) 110.51± 37.58
Conclusion: ESRD patients are at higher risk and it is expected to have serum lipids as per NCEP-ATP-III guidelines. In contrast to this, where these levels are associated with increased risk of CVD, decrease values in dialysis patients are strongly correlated with increased morbidity including a higher risk of cardiovascular events and death. This observation is referred as “reverse epidemiology/risk factor–paradox”. It may be due to superimposed factors like inflammation and/or malnutrition that lead to lower cholesterol levels. In addition, chronic renal failure per se, primarily affects the metabolism of HDL-C and Triacylglyceride rich lipoproteins. Despite conflicting reports, hypercholesterolemia paradoxically appears to be associated with more favorable outcome in ESRD patients.
Introduction
Globally, Chronic Kidney Disease (CKD) is the 12th cause of death and 17th cause of disability[1] with more than 90% disease burden, because of rapidly increasing worldwide incidence of diabetes[2] and hypertension.[3], [4] CKD is a pathophysiological process lasting for more than 3 months with progressive and irreversible deterioration of renal function. Diabetic glomerular disease is the major cause of CKD (31.2%) in India.[5] As per clinical guidelines of National Kidney Foundation (NFK/KDOQI), ESRD represents 5th stage of CKD with GFR less than 15 mL/min/1.73m2 resulting in uremic syndrome and death. This requires Hemodialysis (HD) to reduce its morbidity and mortality[5] and Maintenance hemodialysis (MHD) is maintaining the dose prescription of frequency three times per week.
With increasing prevalence of CKD, its importance and risk factors and CKD related cardiovascular diseases need to be considered. Hence, lipid profile was studied in maintenance hemodialysis subjects.
Aim & Objective
To estimate and analyze serum lipid levels in the ESRD patient undergoing hemodialysis.
Materials and Methods
An observational study was carried out for a period of one year (July 2014-June 2015). The study group consists of 100 patients diagnosed as ESRD on MHD of age group 18-70 years of both sex from Nephrology unit. Hundred cases were taken as a convenient sample size since the exact prevalence of the disease is unknown.
ESRD patients on maintenance hemodialysis for > 6months and HD minimum 2-3 times per week were analyzed. We excluded ESRD patients not receiving their prescribed dialysis dose, showed persistent non-compliance with their dialysis therapy and diagnosed cases with hepatic diseases.
Ethical clearance was obtained from the ethical committee. After detailed history and informed consent, about 2-3 ml of blood was drawn from the ESRD patients before and after hemodialysis in the same session. Serum was separated and used for analysis of lipid profile, creatinine and urea. Urea was estimated by GLDH-Urease method, serum creatinine by Jaffe’s method, total cholesterol by CHOD-PAP method, triglyceride by GPO-Trinder method, HDL by precipitation enzymatic method and LDL cholesterol by Friedewald’s formula.[6], [7]
Results were expressed as mean ± standard deviation (SD). Statistical analysis was done using IBM SPSS software version 19. The probability value (P value) of less than 0.05 was considered statistically significant.
Results
Age distribution of Hemodialysis patients studied were 66% of more than 40yrs and 34% of less than 40 yrs. Males were 68% and female 32%.
| Parameters (mg/dl) | Pre dialysis (µ±SD) | Post dialysis (µ±SD) |
| Urea | 110.51±37.58 | 41.50±19.98 |
| Creatinine | 8.28±2.45 | 3.69±1.75 |
| Total cholesterol | 131.93±49.75 | 130.62±42.29 |
| Triglyceride | 107.53±52.36 | 110.22±48.84 |
| HDL-C | 28.93±10.06 | 29.43±8.81 |
| LDL-C | 82.23±42.89 | 79.18±38.59 |
| Parameters (mg/dl) | Pre dialysis cases, n=100 | Post dialysis cases, n=100 | |
| Total cholesterol | < 200 | 93 | 96 |
| >200 | 07 | 04 | |
| Triacylglyceride | <150 | 80 | 84 |
| >150 | 20 | 16 | |
| HDL-C | <35 | 79 | 79 |
| 35 - 60 | 18 | 21 | |
| >60 | 03 | 0 | |
| LDL-C | < 100 | 70 | 75 |
| 100-129 | 16 | 15 | |
| ≥ 130 | 14 | 10 |
| Parameters | Mean ± SD | P value |
| Urea (mg/dl) | 69.01±30.60 | 0.000* |
| Creatinine (mg/dl) | 4.58±2.25 | 0.000* |
| Total cholesterol (mg/dl) | 1.31±14.34 | 0.363 |
| Triglyceride (mg/dl) | 2.69±13.41 | 0.047ǂ |
| HDL-C (mg/dl) | 0.50±2.20 | 0.025ǂ |
| LDL-C (mg/dl) | 3.0±19.68 | 0.124 |
Discussion
In this study we found 66% of study subjects of more than 40 years of age with mean value of 46.89±14.01 years. This is in accordance with studies on epidemiology of CKD which states that the incidence rate of ESRD is 2 to 3 folds higher in the 20-60 year age group than in the 61-74 year age group.[8] Males were more (68%) and females were less (32%) with 2.1:1 ratio, which is in accordance to the data of Indian CKD registry.[9] This gender difference can be attributed to the fact that females experience lower ESRD risk than males. Similar studies by R. Radha et al.,[10] Dipika Baria et al[11]and Azar B et al.[12] found average age of 48±13.8, 44.27±10.7 and 46.6±17 years with 1.3:1, 1.5:1 and 1.4:1 male female ratio respectively. In contrast to this, a study by Hasan Nasir Abbas et al.[13] showed male female ratio 0.93:1 with mean age 51±15 yrs.
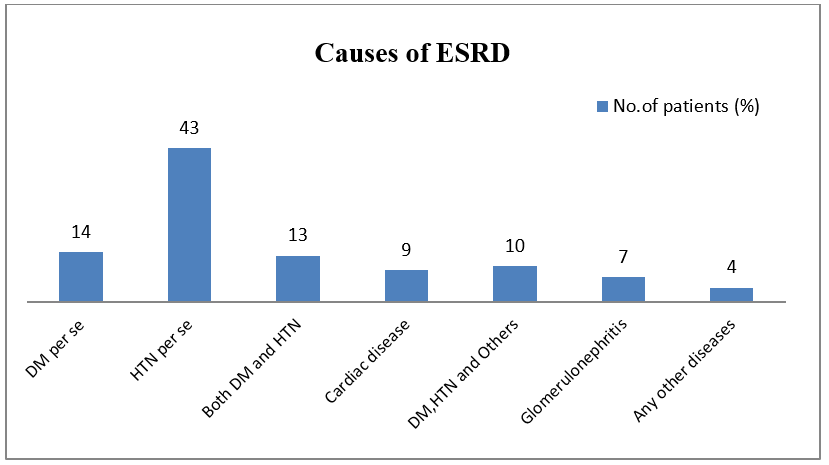
The cause for ESRD in the present study was hypertension per se (43%) followed by Diabetes per se (14%), cardiac disases (9%) and glomerulonephritis (7%). In a similar study by Hasan Nasir Abbas et al.[13] the cause of kidney disease was hypertension in 57% followed by diabetes in 34% and glomerulonephritis in 12% of the patients. Hypertension exists in approximately 80-85% of CKD patients and as GFR decreases, the prevalence of hypertension increases. It is related to RAS activation, sympathetic nervous system stimulation and nitric oxide inhibition.[14] But Vivekanand Jha[15] in his study found Diabetic nephropathy as commonest cause (31.2%) in India followed by chronic glomerulonephritis (13.8%) and hypertension (12.8%). Thiane Gama Axelsson et al.[16] in their study found 35% CVD patients followed by 30% diabetes.
Mean blood urea (mg/dl) in the present study was 110.5±37.5 and 41.5±19.9, serum creatinine (mg/dl) was 8.28±2.45 and 3.69±1.75 in pre and post dialysis respectively. A very significant changes noted in serum creatinine and blood urea after dialysis at P value 0.000.
Serum lipid levels were estimated as nutritional marker. ESRD patients are at higher risk and it is expected to have serum lipids as per National Cholesterol Educational Program ATP III guidelines. Accordingly, Total cholesterol (TC), TAG, HDL-C and LDL-C are low in maximum study subjects with no significant difference in TC and LDL-C levels after dialysis. Hypocholesterolemia is believed to be due to inflammation. It is a marker of poor nutritional status and a strong mortality risk factor in dialysis patients.[17] A study by R. Radha and Girija K.[10] found mean value of TC (135.23±21.8), TAG (110.32±51.4), HDL-C (30.02±4.3) and LDL-C (83.86±18.6) which is similar to our study. Studies by Azar B et al.,[12] Hasan Nasir Abbas et al[13] and K. Kalantar Zadeh et al.[18] showed similar results. But a study by Dipika B et al.[11] found mean TC 172.3±40.7, TAG 243.67±36.07, and LDL 102.8±21.53 mg/dl. Similarly Hsun Yang et al.[19] in their study noticed mean TC levels 169.1±36.68 mg/dl and TG 153.57±105.13 mg/dl.
Markers of over nutrition are associated with increased risk of cardiovascular disease but decrease nutritional measures in dialysis patients are strongly correlated with increased morbidity/mortality, including a higher risk of cardiovascular events and death. These paradoxical observations have been referred to as “reverse epidemiology” or “risk factor–paradox”. This may indicate progressive vascular pathophysiology in the ESRD patients or may denote other superimposed and more dominant factors that cause apparent reversed relationship between risk factors and outcome.[20] It has been suggested that this paradoxical association is spurious and results from either reversed causation in which CVD leads to inflammation and/or malnutrition and lower cholesterol levels or a confounding effect of inflammation and/or malnutrition, which leads to lower cholesterol levels and higher mortality.[21]
Chronic renal failure per se, primarily affects the metabolism of HDL-C and triacylglyceride rich lipoproteins.[22] There is enhanced VLDL production in liver and dysfunction of triacylglyceride degradation resulting from insufficient mitochondrial beta-oxidation of fatty acids. It may be due to deficit of L-carnitine, which absence is frequently found especially in HD patients.[23] Hyperinsulinemia is the main factor increasing the synthesis of TAG and also directly decreasing the activity of liver lipoprotein lipase. These lead to changes in TAG and HDL-C levels.[11] Unlike this, maximum patients may have normal mean TAG levels and LDL-C levels but the cholesterol may originate from the atherogenic small and dense LDL subclass. The apolipoprotein B-containing part of the lipoprotein may undergo modifications leading to impaired LDL receptor-mediated clearance from plasma and promote circulation of LDL. Also HDL-C particles become structurally altered due to inflammation.[24]
Conclusion
ESRD patients being at higher risk of mortality are on treatment and we have observed maximum patients with normal to low serum lipid levels. This observation is in accordance with reverse epidemiology. It may be due to superimposed factors like inflammation and/or malnutrition that lead to lower cholesterol levels. In addition, chronic renal failure per se, primarily affects the metabolism of HDL-C and triacylglyceride rich lipoproteins. Despite conflicting reports, hypercholesterolemia paradoxically appears to be associated with a more favorable outcome in ESRD patients.
Source of Funding
None.
Conflict of Interest
None.
References
- Veerappan I, Abraham G. Chronic Kidney Disease: Current Status, Challenges and Management in India. Med Update. 2013;130:593-7. [Google Scholar]
- Wild S, Roglic G, Green A, Sicree R, King H. Global Prevalence of Diabetes: Estimates for the year 2000 and projections for 2030. Diabetes Care. 2004;27(5):1047-53. [Google Scholar]
- Gupta R. Trends in hypertension epidemiology in India. J Hum Hypertens. 2004;18(2):73-8. [Google Scholar]
- Anand MP. Prevalence of hypertension amongst Mumbai executives. J Assoc Physicians India. 2000;48(12):1200-1. [Google Scholar]
- Joanne MB, Skorecki K, Fauci AS, Kasper DL, Braunwald E, Hauser SL, et al. Chronic Kidney Disease. Harrison’s Principles of Internal Medicine. 2012. [Google Scholar]
- Gowenlock AH, Mcmurray JR, Mclauchlan MD. . Varley’s Practical Clinical Biochemistry. 1988. [Google Scholar]
- Alan TR, Nader R, Warnick G, Burtis C, EA, Bruns D. Lipids, lipoproteins, apolipoproteins and other cardiovascular risk factors. Tietz Textbook of clinical chemistry and molecular diagnostics. 2012. [Google Scholar]
- Cobalt A, Landais P. Epidemiology of chronic renal failure in the elderly. Rev Prat. 2005;55(20):2230-6. [Google Scholar]
- . CKD Registry of India: Three year cumulative annual report, 2008. . . [Google Scholar]
- Radha R, Girija K. Eating Disorders in Hemodialysis Patients. Int J Food Nutr. 2013;2(3):120-3. [Google Scholar]
- Baria D, Joshi V, Shah T, Gandha K, Modi N. Imapct of Hemodialysis on lipid profile among chronic renal failure patients- A case control study. Int J Sci Res Publication. 2013;3(7):1-3. [Google Scholar]
- Baradaran A, Nasri H. Association of Serum C-Reactive Protein (CRP) with Some Nutritional Parameters of Maintenance Hemodialysis Patients. Pak J Nutr. 2005;4(3):175-82. [Google Scholar]
- Abbas HN, Rabbani MA. Biochemical nutritional parameters and their impact on HD efficiency. Saudi J Kidney Dis Transpl. 2009;20(6):1105-9. [Google Scholar]
- Inci A, Kursat S. Dilek Aslan Kutsal, Cevval Ulman and Veysel Yavuz. Hypervolemia-malnutrition in renal failure:Is there a relationship?. Clin Nephrol Urol Sci. 2015;2(1):1-8. [Google Scholar]
- Jha V. Current status of end-stage renal disease care in India and Pakistan. Kidney Int Suppl. 2013;3(2):157-60. [Google Scholar]
- Gama-Axelsson T, Heimbürger O, Stenvinkel P, Bárány P, Lindholm B, Qureshi AR. Serum Albumin as Predictor of Nutritional Status in Patients with ESRD. Clin J Am Soc Nephrol. 2012;7(9):1446-53. [Google Scholar]
- Liu Y, Coresh J, Eustace JA. Association between cholesterol level and mortality in dialysis patients, role of inflammation and malnutrition. JAMA. 2004;291(4):451-9. [Google Scholar]
- Kalantar-Zadeh K, Kopple JD, Humphreys MH, Block G. Comparing outcome predictability of markers of malnutrition-inflammation complex syndrome in haemodialysis patients. Nephrol Dial Transplant. 2004;19(6):1507-19. [Google Scholar]
- Yang H, Tung C, Lei C, Hsu Y, Lee P, Chang H. Dialyzer Membrane Characteristics as an Independent Predictor of Clinical Outcomes in Hemodialysis Patients. Acta Nephrol. 2011;25(3):105-12. [Google Scholar]
- Kalantar-Zadeh K, Block G, Humphreys MH, Kopple JD. Reverse epidemiology of cardiovascular risk factors in maintenance dialysis patients. Kidney Int. 2003;63(3):793-808. [Google Scholar]
- Baigent C, Wheeler DC. Should we reduce blood cholesterol to prevent cardiovascular disease among patients with chronic renal failure?. Nephrol Dial Transplant. 2000;15(8):1118-9. [Google Scholar]
- VAZIRI ND, MORADI H. Mechanisms of dyslipidemia of chronic renal failure. Hemodialysis Int. 2006;10(1):1-7. [Google Scholar]
- Cibulka R, Racek J. Metabolic disorders in patients with chronic kidney failure. Physiol Res. 2007;56:697-705. [Google Scholar]
- Kalantar-Zadeh K, Ikizler T, Block G, Avram MM, Kopple JD. Malnutrition-inflammation complex syndrome in dialysis patients: causes and consequences. Am J Kidney Dis. 2003;42(5):864-81. [Google Scholar]