- Visibility 0.9k Views
- Downloads 59 Downloads
- Permissions
- DOI 10.18231/j.ijcbr.2020.006
-
CrossMark

Abstract
Lipid profile is done in fasting blood specimen commonly, the reasons being: 1. Triglycerides remain elevated for several hours in postprandial state, 2. Reference range are established for fasting serum lipid profile.
This study was proposed to compare the lipid profiles obtained in fasting and non-fasting conditions. If a reliable correlation between fasting and non-fasting lipid profile will be obtained, assay for lipids in non-fasting state may be adopted for clinical evaluation. This might help in reducing the difficulties faced in obtaining the sample in fasting state.
Materials and Methods: This was a cross-sectional study, conducted from October 2011 to October 2013. Total of 200 subjects were included in the study. Two Samples were collected from each individual, one sample after 8-12 hours fasting and second sample in non-fasting state (random sample). Total cholesterol, Triglycerides, HDL-cholesterol were analyzed by standard methods and, LDL-cholesterol was calculated using Friedewald’s formula.
Results: Significant increase was observed in non-fasting Triglyceride and VLDL-C as compared to fasting samples in total population, but we observed significant difference in total cholesterol and LDL-C in total population. Significant reduction was observed in HDL-C in non-fasting state as compared to fasting state. Positive correlation was observed between fasting and non-fasting total cholesterol triglyceride, VLDL-C, HDL-C and LDL-C in the total population.
Conclusion: Non-fasting sample can be used to measure Total cholesterol and HDL-C. Non-fasting sample can be used to measure triglyceride, VLDL-C and LDL-C provided reference intervals are established in non-fasting state for the same in larger population.
Introduction
Lipid profiles are batteries of tests which include the measurement of lipids and lipoproteins such as cholesterol, triglycerides (TG) and LDL-cholesterol, HDL-cholesterol, VLDL-Crespectively, of an individual.
Lipids and lipoproteins are intimately involved in the development of atherosclerosis, which is the underlying cause of cardiovascular disease like myocardial infarction. It can also cause cerebrovascular disease and peripheral vascular disease.[3], [2], [1]
Dyslipidemia can also be seen in many genetic disorders like familial hypercholesterolemia. This is caused due to defect in the expression and/or function of LDL receptor. It leads to accumulation of LDL in plasma, leading to deposition of cholesterol in skin, tendons, and arteries, where it causes accelerated atherosclerosis, resulting in premature CHD and death.[3], [1]
Presently cardiovascular diseases are the leading cause of morbidity and mortality in developing countries like India.
In view of above data and also emerging data on the impact of early life events on adult chronic diseases, it is appropriate to consider preventive strategies for atherosclerosis at an early stage of life.
Usually the lipid profile is done in fasting blood specimen, due to two main reasons:
Triglycerides remain elevated for several hours in postprandial state and is variable
Reference range s are established for fasting serum lipid profile,[4] and not in non-fasting state
As recommended by National cholesterol education program-adult treatment panel- III (NCEP-ATP III) current guidelines, for cardiovascular risk assessment lipid profile should be obtained while in fasting state of at least 8-12 hours . The other recommendation is that initial screening should include a fasting lipid profile that includes total cholesterol, LDL cholesterol, HDL cholesterol, and triglycerides.[5] But however the guidelines also allow for the measurement of total and HDL cholesterol in the non-fasting state, because when measure in fasting or non-fasting state there is very minimal alteration of these two lipids.[7], [6] A secondary target of therapy in ATP-III that is, non-HDL cholesterol can also be used in the non-fasting state.[5]
This study was proposes to test the feasibility, of using non-fasting sample to estimate lipid profile, by comparing the lipid profiles obtained in fasting and non-fasting conditions. If a reliable correlation is observed between fasting and non-fasting lipid profile then, the assay for lipids in non-fasting state may be adopted for clinical evaluation. This might help in reducing the difficulties faced in obtaining the sample in fasting state.
Materials and Methods
This was a cross-sectional study conducted in K S Hegde charitable hospital Mangalore. 200 patients[8] were included in the study. Duration of the study was 3yrs between November 2011 and June 2013. Ethical clearance was obtained from the institutional ethical committee before the start of the study. The informed consent was obtained from the subjects who were willing to participate in the study. The subjects were selected based on the clinical history and clinical examination.
The subjects for the study were randomly selected from the population, which included medical student, employees of all cadres at the hospital. A few subjects who attended the hospital, under health plan scheme were also recruited for the study.
Analysis was done in clinical biochemistry laboratory.
Healthy individuals aged between 18-55yrs with BMI (Body mass index) between 18-24.99kg /m 2 were included in the study. Subjects with cardiovascular disease, diabetes mellitus, hypertension, malnutrition, renal diseases, cerebrovascular diseases, sepsis, medications, alcohol abuse, smoking, endocrine disorders, Pregnancy, various storage disorders, congenital biliary atresia, dyslipidemia, obesity, strenuous exercise, HRT were excluded from the study.[10], [9] (3)
Methods
Anthropometric measurements: Height was measured in cms without shoes by standard procedure and weight was measured in kg and used for calculation of body mass index.
Method of sample collection: 2ml of Blood Sample was collected, one sample after 8-12 hrs fasting and second sample in non-fasting state (random sample). lipid profile parameters were assayed in duplicate to minimize analytical variation[11] in Roche Hitachi (902) autoanalyzer.
Quality control: The analyzer was calibrated with materials provided by the Bio-rad. Changes in calibration curve and specificity of the analytical method were detected by using a number of accuracy control specimens, at both normal (level-I) and pathological (levels-II) of concentration, for the lipid profile analytes. During the study there were no change in the equipment, reagents, calibration standards, and controls.
The following parameters were analysis
Serum total cholesterol[12]
Measured by CHOP-PAP (cholesterol oxidase-peroxidase 4-aminoantipyrine) method using commercially available kit.
Serum triglycerides[13]
Measure by GPO-PAP (glycerol- 3 phosphate oxidase-peroxidase N-ethyl-N-Sulfopropyl-n-anisidine) method using commercially available kit
Serum Hdl - cholesterol[14]
Measured by homogenous (direct) enzymatic method using commercially available kit.
Serum LDL-Cholesterol[15]
Calculated by Friedewald’s equation.
LDL cholesterol is calculated by using a standard WHO approved formula based on total cholesterol, triglyceride and HDL-cholesterol values.
Statistical analysis
SPSS- version 17 was used to analyze the data. The parameters which followed a Gaussian probability curve according to Kolmogorov-Simrnov test for normality were analysed by parametric test. The parameters which did not follow a Gaussian probability curve were analysed by non-parametric test. The comparison study of fasting and non-fasting lipid profile was analyzed by student paired ‘t ’ test. For total cholesterol and LDL-C parametric students paired ‘t ’ test was done. Triglycerides, HDL-C, VLDL-C were fit for non-parametric test, Wilcoxon signed rank test. Correlation was done by Pearson’s correlation.
Results
In this study 200 subjects were included. Among which 126 were females and 74 were males. Mean age for total population was 31.29. Mean age for male was 30.29±8.79, and for females was 31.89±8.88
Mean BMI for males was 23.8±2.36, and for females was 22.7±1.67
No significant difference was observed between mean fasting TC and LDL-C levels and non- fasting TC and LDL-C, but significant difference was observed between mean fasting HDL-C, TG, VLDL-C levels and non-fasting HDL-C, TG, VLDL-C levels. The mean TG and VLDL-C levels is higher in non-fasting state (135.38 & 27.43 respectively) than in fasting state (96.01& 19.34 respectively), but was decrease in non-fasting HDL-C and LDL-C (45.08 & 116.63 respectively) as compared to fasting (48.05 & 121.68) ([Table 1][Figure 1])
A strong positive correlation was observed between fasting total cholesterol and non-fasting total cholesterol, fasting triglyceride and non-fasting triglyceride, and fasting LDL-C and non-fasting LDL-C. A positive correlation was observed between fasting HDL-C and non-fasting HDL-C and fasting VLDL and non-fasting VLDL-C.
| Mean ±SD | |||
| Parameter | Fasting (mg/dl) | Non-fasting (mg/dl) | P value |
| Total cholesterol | 187.89±30.43 | 188.54±33.68 | 0.56 |
| Triglyceride | 93.33± 42.19 | 117.46±42.25 | 0.001** |
| HDL-C | 48.13± 9.95 | 45.26±10.81 | 0.001** |
| VLDL-C | 19.02±8.90 | 23.86±8.75 | 0.001** |
| LDL-C | 121.49±28.98 | 119.50±32.11 | 0.116 |
| Mean ±SD | |||
| Parameter | Fasting (mg/dl) | Non-fasting (mg/dl) | Percentage difference |
| Total cholesterol (TC) | 187.89±30.43 | 188.54±33.68 | 0.3 |
| Triglyceride | 93.33± 42.19 | 117.46±42.25 | 22.8 |
| HDL-C | 48.13± 9.95 | 45.26±10.81 | 6.14 |
| VLDL-C | 19.02±8.90 | 23.86±8.75 | 22.5 |
| LDL-C | 121.49±28.98 | 119.50±32.11 | 1.65 |
Shows there is 0.3%, 22.8%, 22.5% increase in non-fasting total cholesterol, triglyceride and VLDL-C as compared to fasting, respectively. There is 6.14% and 1.65% decrease in non-fasting HDL-C and LDL-C as compared to fasting, respectively.
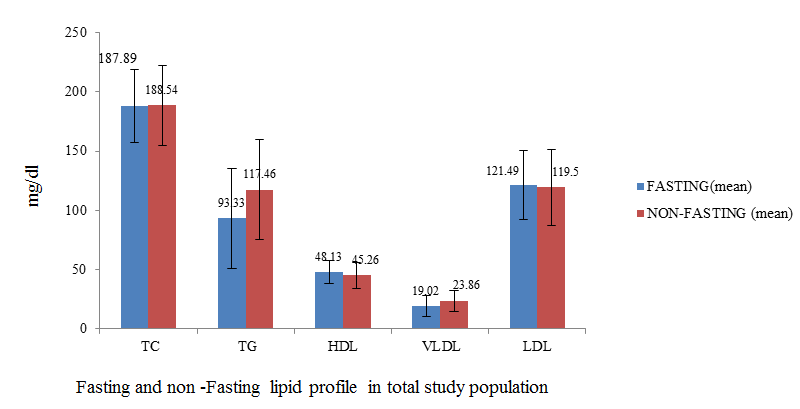
Shows no significant difference between mean TC and LDL-C levels in fasting and non-fasting, but there is a significant difference between mean HDL-C, TG, VLDL-C levels in fasting and non-fasting state. The mean TG and VLDL-C levels is higher in non-fasting state (135.38 & 27.43 respectively) than in fasting state (96.01& 19.34 respectively), but was decrease i n non-fasting HDL-C and LDL-C (45.08 & 116.63 respectively) as compared to fasting (48.05 & 121.68) ([Figure 1])
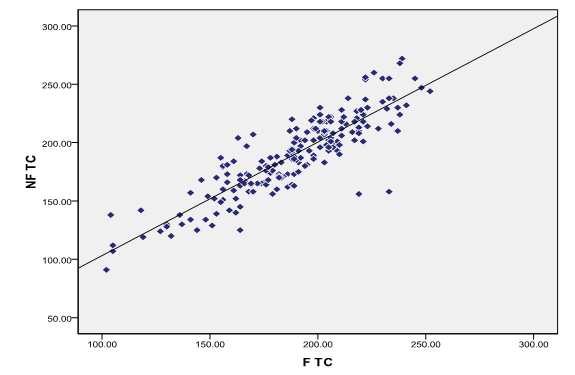
There is strong positive correlation between fasting and non-fasting total cholesterol in total study population ([Figure 2])
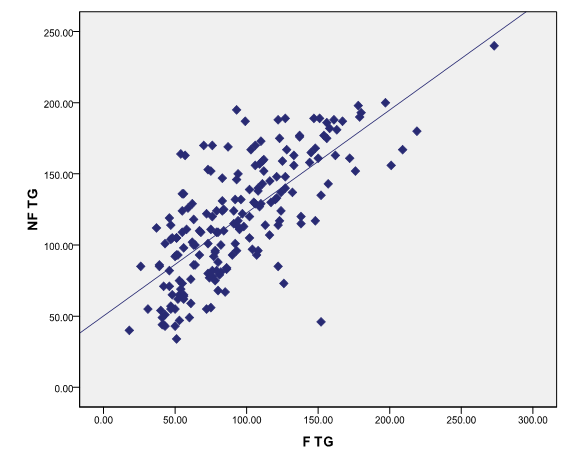
There is strong positive correlation between fasting and non-fasting triglycerides in total study population ([Figure 3])
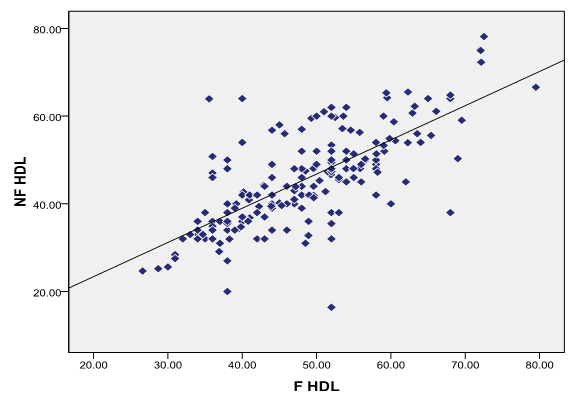
There is correlation between fasting and non-fasting HDL-C in total study population ([Figure 4])
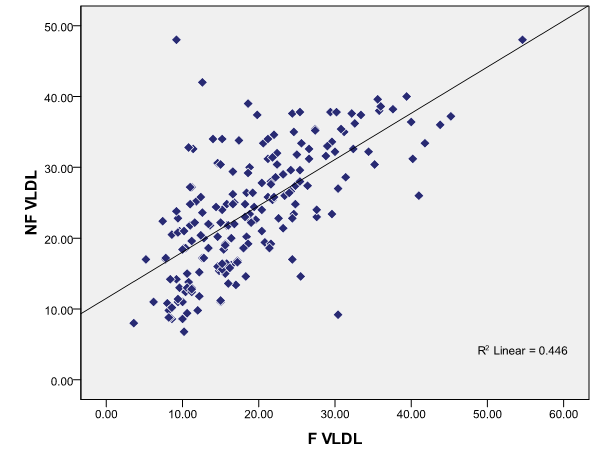
There is positive correlation between fasting and non-fasting VLDL-C in total study population ([Figure 5])
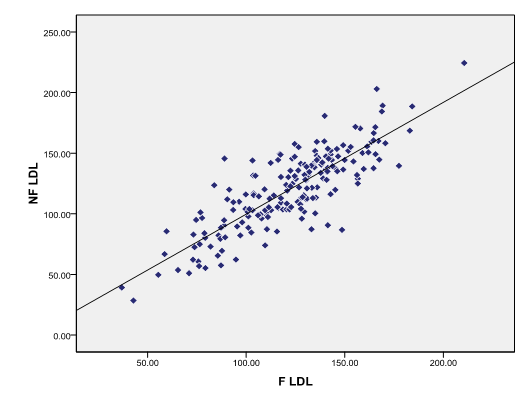
There is strong positive correlation between fasting and non-fasting LDL-C in total study population ([Figure 6])
Discussion
It is been common practice to measure the lipids and lipoproteins after 8 to 12 hours of fasting, this is reduce the in fluence of postprandial lipemia.[16] But several meals are consumed throughout the day by the individuals and there are some people who do consume snacks also in between the meals; therefore the postprandial state predominates over a 24 hour period and hence daily average plasma lipid and lipoprotein concentrations may not be reflected in fasting sample and may not reflect the associated risk of cardiovascular disease.[17], [4]
So we conducted the study to compare the lipid profile in fasting and non-fasting state.
In present study, when we compared fasting lipid profile with non-fasting lipid profile, we observed significant difference in the fasting TG, HDL-C, VLDL-C and non-fasting TG, HDL-C, VLDL-C, but there was no significant difference in the total cholesterol and LDL-C in total study population.
There was significant increase in the non-fasting triglycerides compared to fasting triglycerides.
Difference in the fasting and non-fasting triglyceride was also shown in studies done by Anne Langsted et al,[18] Jouko Sundvall et al,[19] who observed increase in Triglycerides in response to normal food intake even after the correction for albumin levels.
This increase in triglycerides is attributable directly to fat intake. Anette Varbo and colleague[20] concluded that step wise increasing non-fasting TG was related with high risk of ischemic stroke in both males and females. Sandeep Bansal et al[21] showed that, to evaluate the cardiovascular risk triglyceride in non-fasting state may be superior to triglyceride in fasting state.
Measuring triglyceride in fasting state may be insufficient representation of vascular risk, if Postprandial TG is biologically active in atherogenesis.[21]
Many studies have proved it as an independent risk factor for CVD. The adverse effect of postprandial triglycerides is thought to be mediated by proatherogenic lipolysis products of nascent triglyceride rich lipoproteins, such as remnant lipoproteins and fatty acids, and even a transient increase in these factors may worsen vascular function.[22]
We observed that, difference between fasting total cholesterol and non-fasting total cholesterol was not significant, non-fasting total cholesterol, showed only 0.30% increase in total population, which was similar to the observation made by Craig SR et al,[6] who also observed in their study that fasting total cholesterol and non-fasting cholesterol was not significantly different. Anne Langsted et al also showed total levels did not change in response to normal food intake after adjustment for albumin levels.
A strong positive correlation was observed between fasting total cholesterol and non-fasting total cholesterol in the total population, so total cholesterol can be measured in non-fasting state, which is also recommended by National Cholesterol Education Program.
There was a decrease in the non-fasting LDL-C as compared to fasting LDL-C in total study population (n=200) (mean ± SD fasting & non-fasting = 121.49±28.98, 119.50±32.11 respectively). The reduction is not significant (p0.116) in total study population, this reduction which is seen after taking normal food may be because of hemodilution caused by fluid intake. This may also be due to significantly high non-fasting TG which is used in the Friedewald formula for calculating LDL-C. Study done by Samia Mora et al,[23] wherein they compared the direct method of measuring LDL-C to calcula ted method found that the LDL-C values obtained by two methods were highly correlating, in - fact direct method showed lower values. They also studied fasting and non-fasting LDL-C with both the method and concluded that in non-fasting state neither of the method for LDL-C predicted the future cardiovascular risk. So in present study we calculated LDL-C with Friedewald formula, which may not differ from the direct method and be useful in predicting cardiovascular event in fasting samples as recommended by NCEP guidelines.
Jouko Sundvall et al[19] concluded that non-fasting LDL-C calculated from the non-fasting TG can misclassify subjects as having LDL-C lower as compared to true fasting values. These low values of the non-fasting LDL-C may misclassify the subjects according to NCEP-ATP guideline as normal, so it is better to measure LDL-C in fasting state as also recommended by NCEP-ATP.
In present study, there was significant increase in non-fasting in total study population (n=200) (mean ±SD fasting & non-fasting= 19.02±8.90, 23.86±8.75 respectively) (p<0.001).
22.50% increase is observed in non-fasting VLDL-C in total population
This increase can be explained by the high non-fasting triglyceride which is divided by factor 5 to get the VLDL.
Fasting VLDL-C and non-fasting VLDL-C in the total population showed a positive correlation.
Significant decrease in HDL-C in the non-fasting state was seen when compared to fasting samples in total study population (n=200) (mean± SD fasting and non-fasting= 48.09± 9.99, 45.26±10.93 respectively) (p<0.001). These results are similar to the results in study done by Anne Langsted et al[18] who have reported; decrease HDL-C in response to normal food intake even after the correction for albumin levels and thus correction for hemodilution due to fluid intake. Therefore, the changes in these levels are most likely due to food intake rather than fluid intake.
Reduction in HDL cholesterol likely is due to bidirectional lipid exchange between lipoproteins rich in triglyceride and HDL particles: triglycerides from triglyceride-rich lipoproteins to HDL are transferred by lipid transfer proteins, with Cholesteryl esters being back transferred from HDL to lipoproteins rich in triglyceride.[18]
The National Cholesterol Education Program advises that HDL cholesterol can be used in the non-fasting state.
Conclusion
In the present study, no significant difference was seen in fasting total cholesterol and non-fasting Total cholesterol, hence we can be measure total cholesterol in non-fasting state.
We observed a correlation between fasting HDL-C and non-fasting HDL-C in the study, hence it also can be measured in non-fasting state.
We also observed a positive correlation between fasting triglyceride and non-fasting triglyceride, hence triglycerides can also be measured in non-fasting state, provided a standard reference interval is established in non-fasting state.
Limitations of the study
Sample size: need is there to study on larger population
Direct method of estimating LDL-C should have been compared to calculated method
Source of funding
None.
Conflict of interest
None.
References
- Burtis CA, Ashwood ER, Eds DEB. Tietz fundamentals of clinical chemistry. Saunder. 2008. [Google Scholar]
- Michael M, Cox DL, Nelson. Principles of biochemistry. . 1990. [Google Scholar]
- Fauci, Braunwald, Kasper, Hauser, Longo, Jameson. Principles of Internal Medicine. Journal of Cardiovascular Translational Research. 2008;2:341-348. [Google Scholar]
- Nigam PK. Serum Lipid Profile: Fasting or Non-fasting?. Indian J Clin Biochem. 2011;26(1):96-97. [Google Scholar]
- . Third report of the national cholesterol education program(NCEP) 2002 expert panel of detection, evaluation and treatment of high blood cholesterol in adults(adult treatment panel III) final report of Circulation. Circ. 2002;106:3143-3421. [Google Scholar]
- Craig SR, Russell DW, NF. Blood cholesterol screening influence of fasting state on cholesterol results and management decisions. J General Intern Med. 2000;15:395-399. [Google Scholar]
- Wilder LB, Bachorik PS, Finney CA, Moy TF, Becker DM. The effect of fasting status on the determination of low-density and high-density lipoprotein cholesterol. Am J Med. 1995;99(4):374-377. [Google Scholar]
- CLSI. How to Define and Determine Reference Interval in clinical Laboratory. . 2000;20. [Google Scholar]
- Tandon N. Intermediary metabolism of lipids and lipid transport: In; lipid disorders: Implications and ting VLDL-C as compared to fasting samples management: B.B Tripathy, Sidharrtha Das. . 2002. [Google Scholar]
- Durgawale P, Patil S, Shukla PS, Sontakke A, Kakade S, Yadav S. Evaluation of reference intervals of serum lipid profile from healthy population in Western Maharashtra. Indian J Clin Biochem. 2009;24(1):30-35. [Google Scholar]
- Folsom AR, Kuba K, Leupker RV, Jacobs DR, Frantz ID. Lipid concentrations in serum and EDTA-treated plasma from fasting and nonfasting normal persons, with particular regard to high-density lipoprotein cholesterol.. Clin Chem. 1983;29(3):505-508. [Google Scholar]
- Allain CC, Poon LS, Chan CSG, Richmond W. Enzymatic Determination of Total Serum Cholesterol. Clin Chem. 1974;20(4):470-475. [Google Scholar]
- McGowan MW, Artiss JD, Strandbergh DR, Zak B. A peroxidase-coupled method for the colorimetric determination of serum triglycerides.. Clin Chem. 1983;29(3):538-542. [Google Scholar]
- Sugiuchi H, Uji Y, Okabe H, Irie T, Uekama K, Kayahara N. Direct measurement of high-density lipoprotein cholesterol in serum with polyethylene glycol-modified enzymes and sulfated alpha-cyclodextrin. Clin Chem. 1995;41(5):717-723. [Google Scholar]
- Friedewald WT, Levy RI, Fredrickson DS. Estimation of the Concentration of Low-Density Lipoprotein Cholesterol in Plasma, Without Use of the Preparative Ultracentrifuge. Clin Chem. 1972;18(6):499-502. [Google Scholar]
- Mora S, Rifai N, Buring JE, Ridker PM. Fasting Compared With Nonfasting Lipids and Apolipoproteins for Predicting Incident Cardiovascular Events. Circ. 2008;118:993-1001. [Google Scholar]
- Das M, Saikia M. Estimation of reference interval of lipid profile in Assamese population. Indian J Clin Biochem. 2009;24(2):190-193. [Google Scholar]
- Langsted A, Freiberg JJ, Nordestgaard GB. Fasting and non-fasting levels, influence of normal food intake on lipids, lipoproteins, apolipoproteins, and cardiovascular risk prediction. Circ. 2008;118:2047-2056. [Google Scholar]
- Sundvall J, Leiviskä J, Laatikainen T, Peltonen M, Salomaa V, Vanhala M. The use of fasting vs. non-fasting triglyceride concentration for estimating the prevalence of high LDL-cholesterol and metabolic syndrome in population surveys. BMC Med Res Methodol. 2011;11(1):63-63. [Google Scholar]
- Varbo A, Nordestgaard B. Anne Tybjaer-Hassen. Nonfasting triglycerides, cholesterol, and Ischemic stroke in the general population. Ann Neurol. 2011;69:628-634. [Google Scholar]
- Bansal S, Buring JE, Rifai N, Mora S, Sacks FM, Ridker PM. Fasting Compared With Nonfasting Triglycerides and Risk of Cardiovascular Events in Women. JAMA. 2007;298(3):309-316. [Google Scholar]
- Ansar S, Koska J, Reaven PD. Postprandial hyperlipidemia, endothelial dysfunction and cardiovascular risk: focus on incretins. Cardiovasc Diabetol. 2011;10(61):1-11. [Google Scholar]
- Mora S, Rifai N, Buring JE, Ridker PM. Comparison of LDL Cholesterol Concentrations by Friedewald Calculation and Direct Measurement in Relation to Cardiovascular Events in 27 331 Women. Clin Chem. 2009;55(5):888-894. [Google Scholar]